← All research

Computational Decarbonization and Sustainable Energy Systems

Buildings, transportation, the electric grid, and computing itself account for a large share of global carbon emissions. As part of the NSF Expeditions in Computing project on Computational Decarbonization of Societal Infrastructure (CoDec), we develop computational methods to measure, reduce, and manage this carbon footprint (vision paper). Our work includes SpiderGen, which uses generative AI to produce procedures for carbon life cycle assessments, and studies of cost-effective incentives for siting solar deployments. We also look at the energy and carbon cost of AI: ECO-LLM orchestrates domain-specific language models across edge and cloud to balance accuracy against resource and energy use. This direction builds on the lab's long history of energy-efficient computing, from low-power PC sleep states to energy-aware mobile systems and smart buildings.

Projects
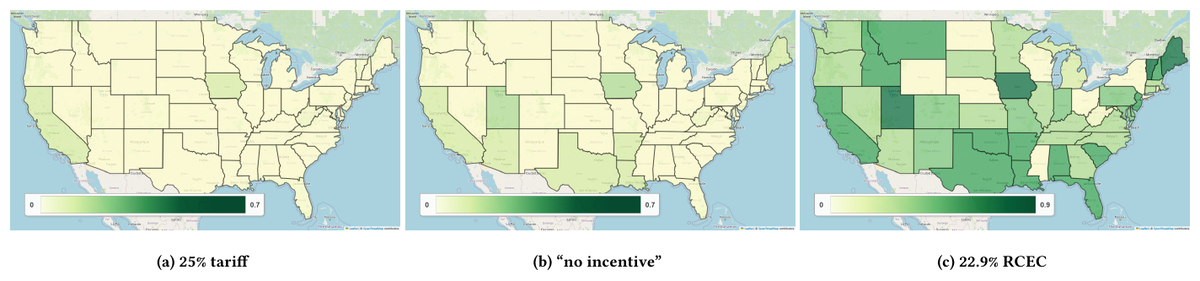
Maps of projected new solar energy generation by U.S. state under a 25% tariff, no incentive, and a 22.9% tax credit.
BuildSys 2026
The Price to Site: Cost-Effective Incentives for Solar Deployment

A nationwide agent-based model of rooftop-solar adoption to design cost-effective incentives as the 30% federal tax credit ends.
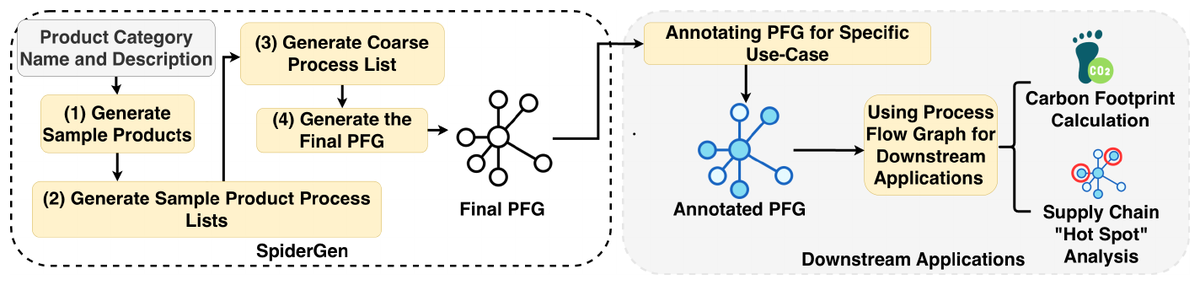
The SpiderGen workflow: generate sample products, coarse process lists, and the final process flow graph, then use it for carbon footprint and supply-chain hot-spot analysis.
AAAI 2026
SpiderGen: Towards Procedure Generation for Carbon Life Cycle Assessments With Generative AI

An LLM workflow that generates the process flow graphs behind carbon life cycle assessments, in minutes and for under $1.
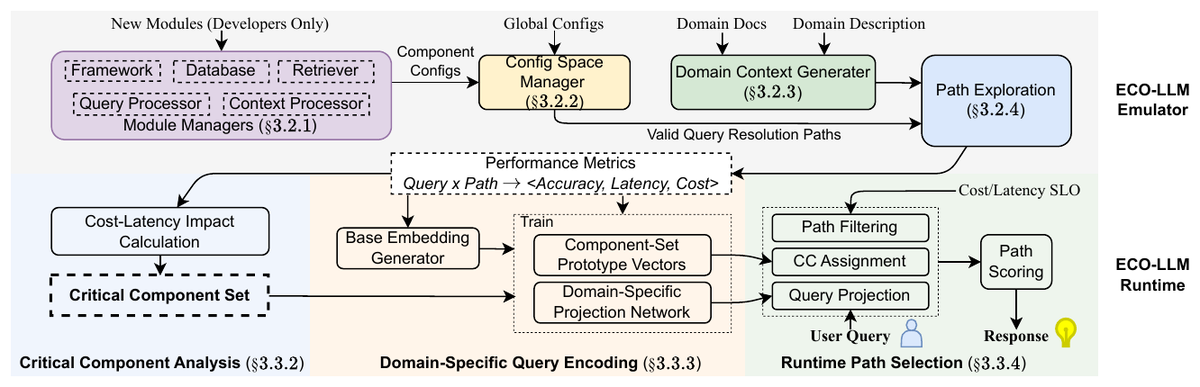
ECO-LLM architecture: an emulator that explores pipeline configurations offline and a runtime that selects a query resolution path under cost and latency SLOs.
arXiv · 2025
ECO-LLM: Orchestration for Domain-specific Edge-Cloud Language Models

Jointly optimizes the whole edge–cloud LLM serving pipeline per query, cutting cost by 60% and latency by up to 6x.
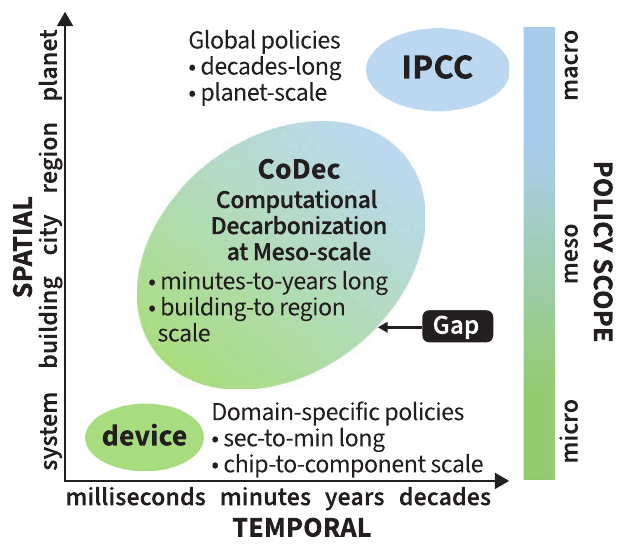
A chart placing computational decarbonization at the meso scale, between device-level decisions and global, decades-long climate policy, across spatial and temporal axes.
IEEE 2025
A Vision for Computational Decarbonization of Societal Infrastructure

A research agenda for cutting lifecycle carbon emissions across interdependent computing, transportation, building, and power-grid infrastructure.
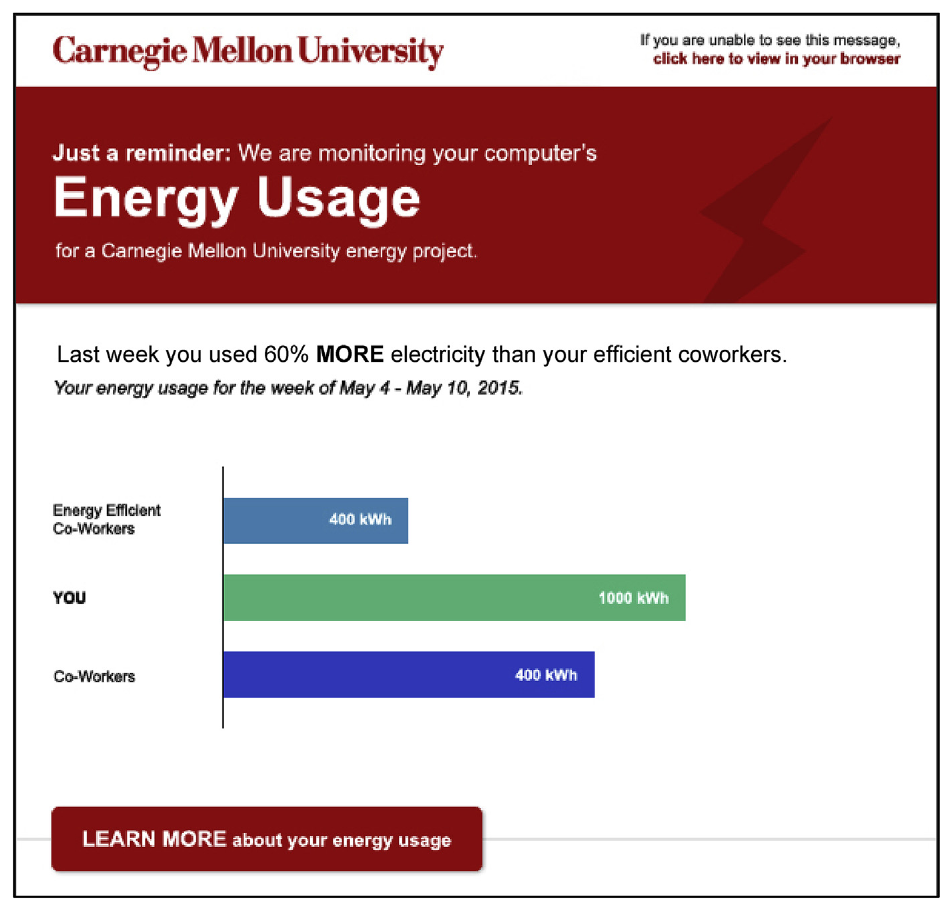
Weekly feedback email telling a staff member they used 60% more electricity than efficient coworkers, with a bar chart comparing their usage to peers.
Energy Policy, 2019
Encouraging energy conservation at work: A field study testing social norm feedback and awareness of monitoring

A 12-week field study with 46 university staff where social-norm energy feedback emails cut computer energy use by 10–11%.

2016 IEEE International Conference on Smart Grid Communications (SmartGridComm)
Dynamic data center load response to variability in private and public electricity costs

Shifting content-delivery load among data centers by hourly electricity prices can cut both operator costs and health and environmental damages from emissions.
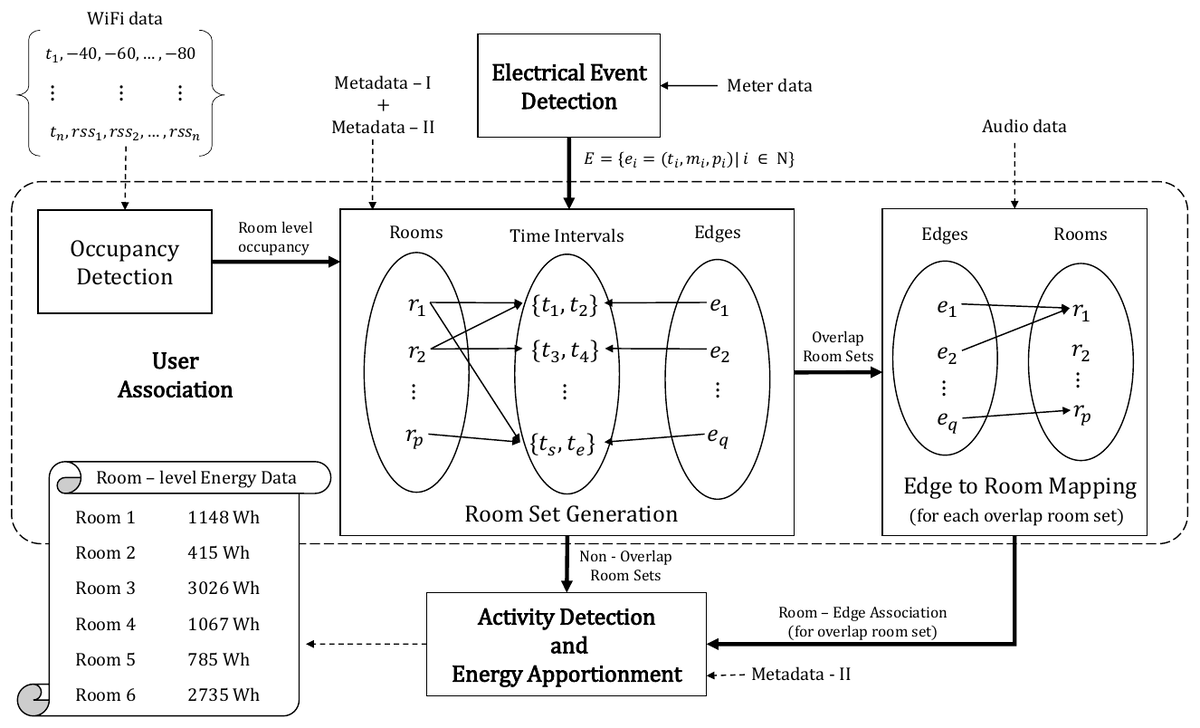
WattShare algorithm flow: meter events, WiFi-based occupancy, and audio data are combined to map electrical events to rooms and output per-room energy use.
Proceedings of the 1st ACM Conference on Embedded Systems for Energy-Efficient Buildings · 2014
WattShare: Detailed Energy Apportionment in Shared Living Spaces Within Commercial Buildings

Splits a dormitory's single smart-meter reading into per-room energy use by fusing meter events with occupants' smartphone WiFi and audio data.
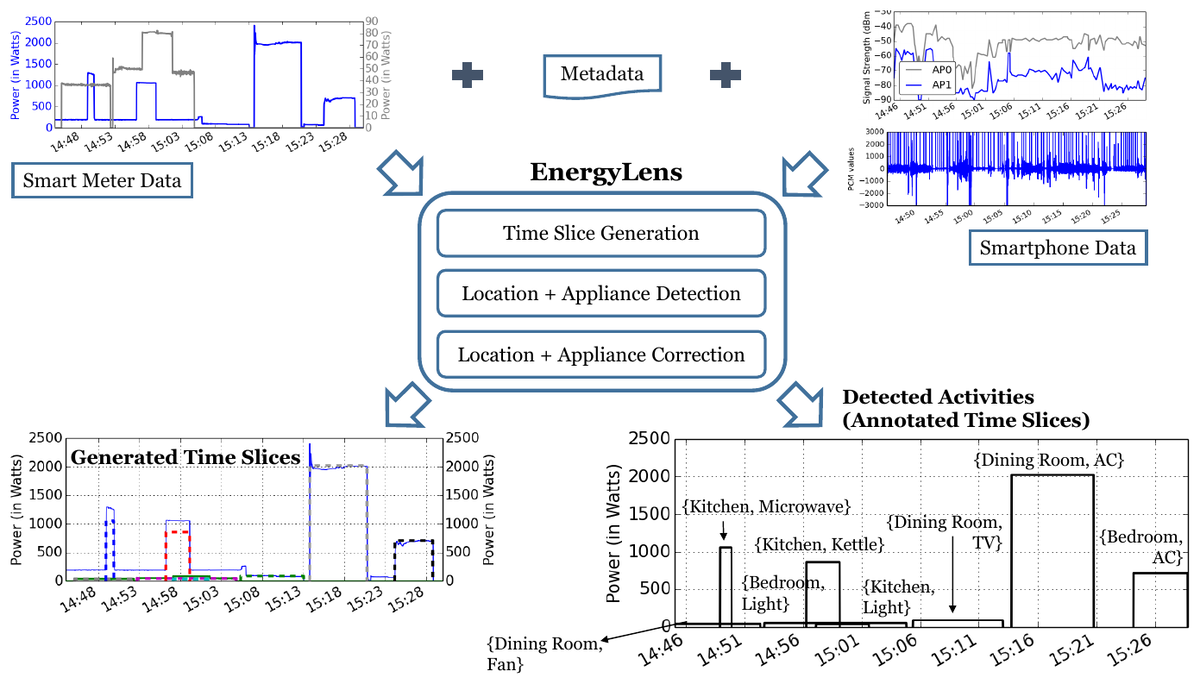
EnergyLens overview: smart meter data, appliance metadata, and smartphone WiFi and audio data feed time slice generation and location and appliance detection, producing annotated activities like Kitchen, Microwave.
Proceedings of the 5th International Conference on Future Energy Systems · 2014
EnergyLens: Combining Smartphones with Electricity Meter for Accurate Activity Detection and User Annotation

Fuses home electricity meter data with smartphone WiFi and microphone sensing to infer which appliance is used, where, when, and by whom.